(Published by JP Bouchaud | July 2025)
Why are financial markets so prone to liquidity crises and crashes?
It is now well established that a large fraction of large price jumps (say, 4-σ events at the 1 min time scale, or major daily moves) cannot be explained by significant news. These jumps seem to be rather the result of endogenous feedback loops that lead to liquidity seizures. The memory of most spectacular ones is still vivid, such as the infamous S&P500 flash crash of May 6, 2010.
These events have triggered a large amount of controversy, in particular
in the general press, pointing fingers at electronic markets and high frequency
traders.
However, financial markets have always been unstable. For example on May 28, 1962, the US stock market suffered a flash crash of severity similar to the that of May 6, 2010. This happened with good old market makers and, obviously, no HFT. Upon closer scrutiny one finds that the frequency of large price moves is remarkably stable over time, once rescaled by volatility.
A plausible general scenario is that of destabilising feedback loops resulting in "micro" liquidity breakdown. Consider for example the classic Glosten–Milgrom model relating liquidity to adverse selection. When liquidity providers believe that the quantity of information revealed by trades exceeds some threshold, there is no longer any value of the bid–ask spread that allows them to break even—liquidity vanishes!
Whether real or perceived, the risk of adverse selection is detrimental to liquidity. This creates a clear amplification channel that can lead to liquidity crises.
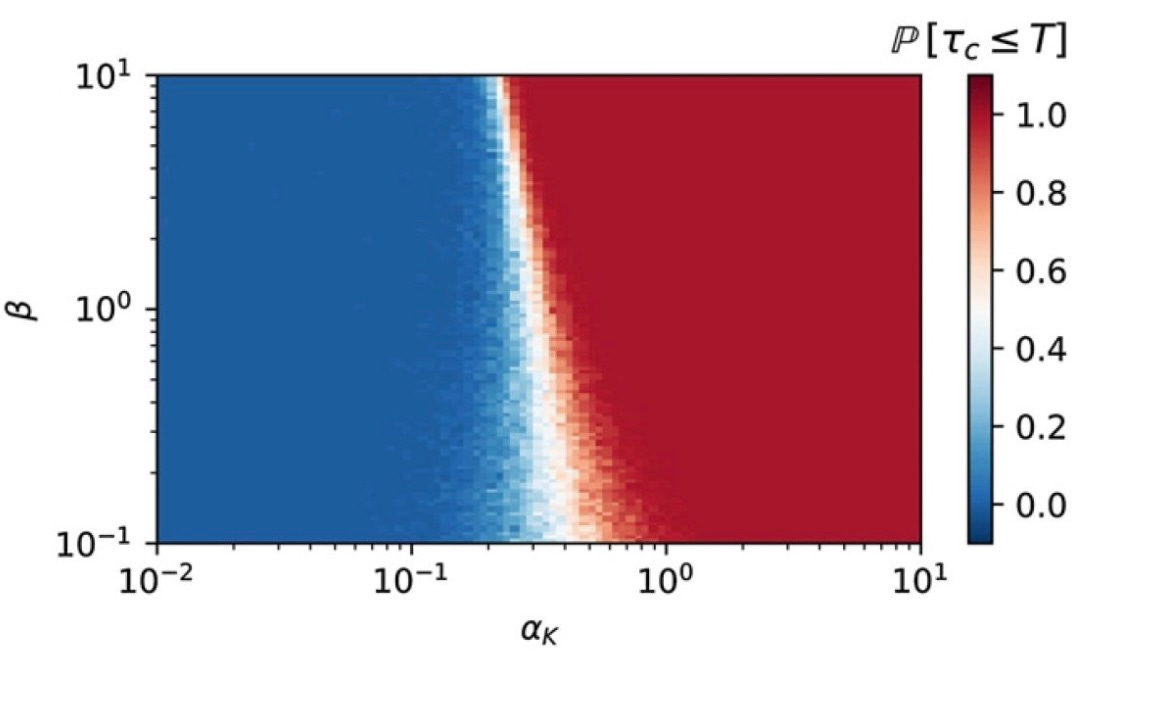
Such a scenario, that was fleshed out and studied in a paper with Antoine Fosset (and more recently revisited by Guillaume Maitrier) is, we believe, at the heart of the excess volatility puzzle. Volatility is a high frequency, microstructural phenomenon that propagates to low frequencies – until price is a factor two away from value, at which point stabilizing, mean-reversion forces set in, exactly as anticipated by Fischer Black. (Read it here).
Figure: alpha is the strength of the volatility/cancellation feedback, beta is the inverse memory time of the feedback. Red region: liquidity crises are inevitable. Blue region: stable order book dynamics.
(I failed to insist on the fact that many major daily price changes of the S&P in the last century are not explained by news either- see the famous paper of Cutler-Poterba-Summers (yes Larry Summers) that was the inspiration for our 1 min study for individual stocks (with much more data). Their conclusion is exactly what I believe in: “evidence that large market moves often occur on days without any identifiable major news releases, casts doubt on the view that stock price movements are fully explicable by news")


