


A “Path Shadowing” Monte-Carlo method
(Published by JP Bouchaud | August 2023)
Faithful models of financial time series are notoriously hard to construct. They must account for a series of “stylized facts” that are highly relevant for risk control and option pricing: fat tails, long memory volatility fluctuations, asymmetries both in returns (past negative returns increase future vol) and in time (past trends, of arbitrary sign, increase vol), etc.
Simple models fail to capture these effects and, correspondingly, generate poor volatility surfaces. The recent Path Dependent Volatility (PDV) model of Julien Guyon offers an interesting compromise, with a relatively low number of factors, but still fails at capturing, e.g., the term structure of the kurtosis of returns.
Another path is to use wavelets, and the so-called “scattering spectra” which are multi-time scales generalization of mixed moments, that compress the information contained in a time series of length T into (log_2 T)**3 parameters by exploiting the scale invariance properties of price processes (but also of turbulent flows, natural images or fracture surfaces). Yet another possibility would be to use generative AI, in a more black-box and less transparent approach.
In any case, once one has devised a good enough generative model of prices, how can it be used to predict, say, future realized volatility and option smiles? The “Path Shadowing Monte-Carlo” method that we developed with Rudy Morel and Stéphane Mallat offers an intuitive and practical answer, illustrated by the figure below:
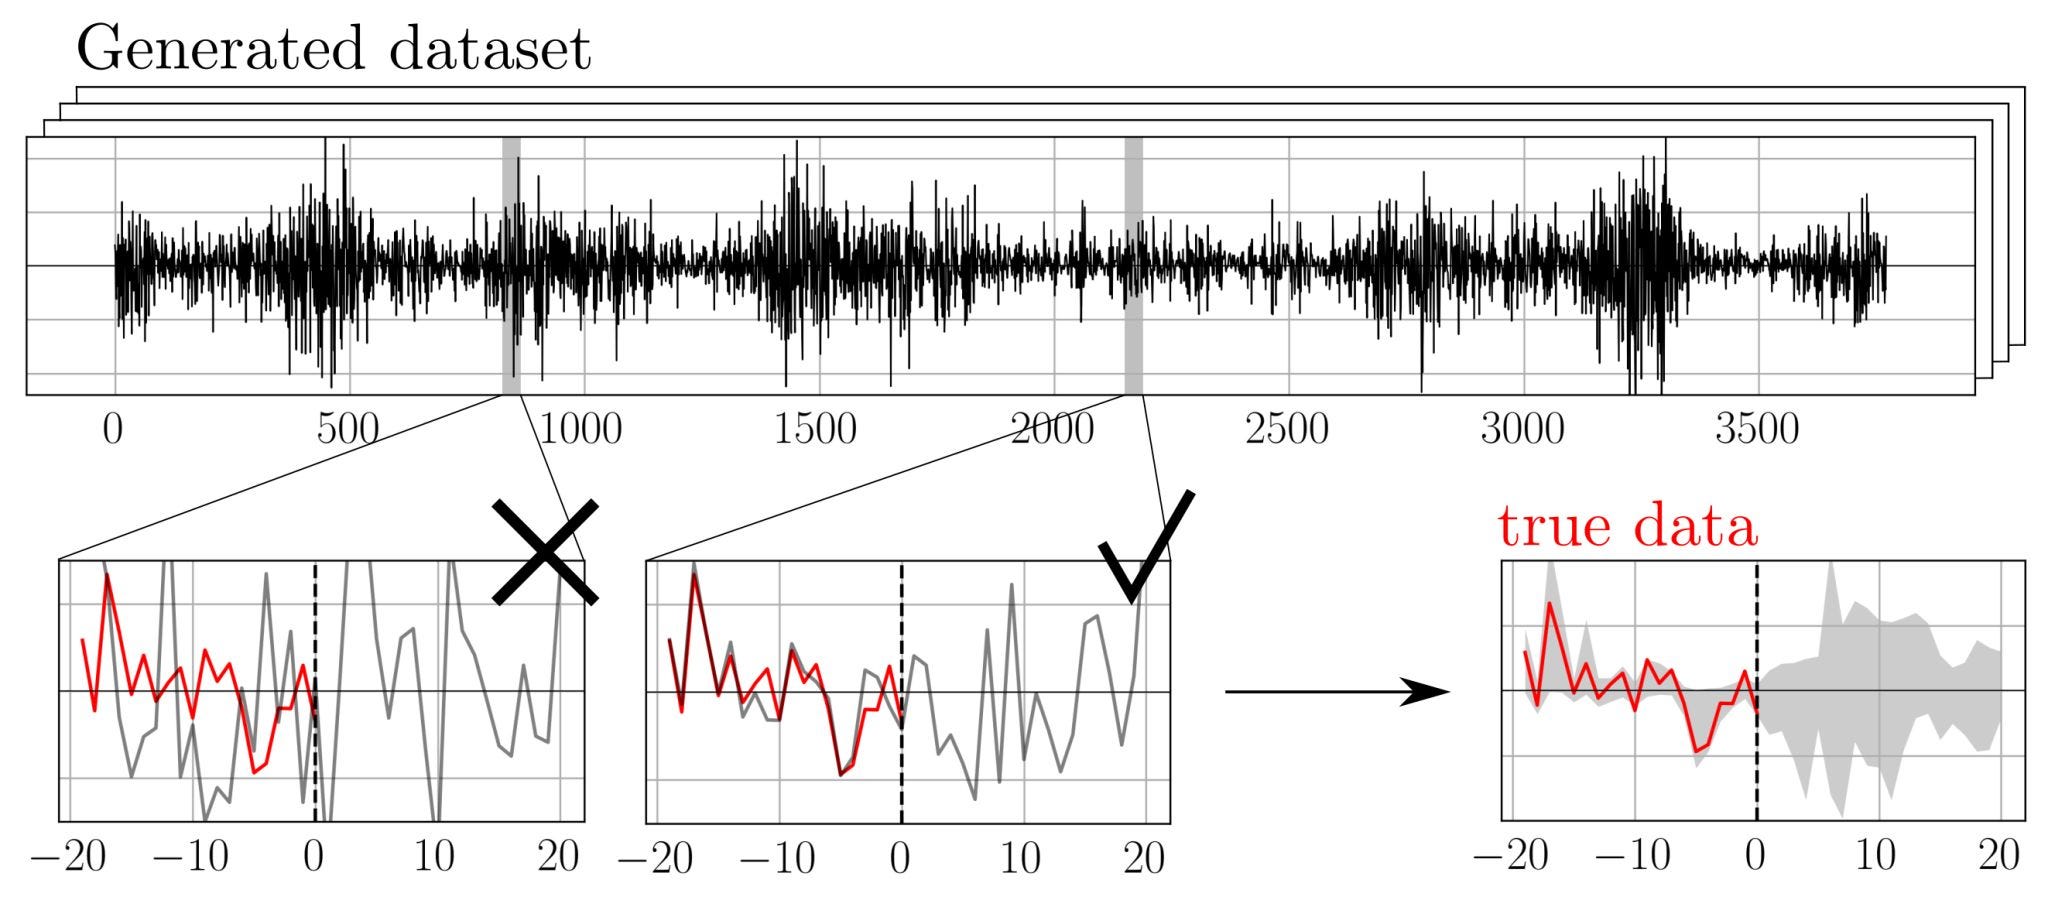
Figure: Path shadowing. Given current past history xpast(red), we scan for paths x(gray) in a generated dataset whose past history satisfies xpast ≈ xipast. Such paths x are said to shadow xepast, they provide insights on the future.
Predictions are obtained through Monte-Carlo on such shadowing paths.
Generate a very long synthetic series of price returns
Scan this fictitious long time series in order to find snippets that match (“shadow”) as well as possible the actual past price series (as seen from today)
Weight these snippets with a decreasing function of the distance between the actual past price path and the synthetic price pathsUse the future returns of these snippets to generate weighted realistic scenarios for actual returns
Compute any observable of interest using a Monte-Carlo method with these weighted paths as inputs
For option pricing, add an appropriate hedging strategy in the computation, as in the “Hedged Monte-Carlo” method that we proposed long ago with Marc Potters
The results, as applied to the S&P 500, are quite cool – for full details, see the paper, that I am really happy with.

Bottom: Aggregated P&Ls of the trading game against the S&P market, played from 2015 to 2023, with a PDV model (re-optimized for each T) or with the Scattering Spectra (SS) model, both calibrated using data from 2000 to 2014.
Top: Time series of S&P log-return on the trading game period.
In particular, we find that our Scattering Spectra model outperforms the current version of the PDV model for realized volatility predictions beyond 7 days and for the term structure of the smile curvature.
#volatility #optionstrading #montecarlo #quantitativefinance